Code Coverage tools
SD supplies code (or test) coverage tools for arbitrary procedural languages. Such tools provide statistics and detail information about which parts of an application program have been executed (usually by a test suite). This information is invaluable to software teams to help determine the readiness of software for actual use. The type of coverage information collected is branch coverage, which subsumes statement coverage.
Code coverage tools may also be used to locate application functionality. One simply exercises the functionality of interest, and the code coverage tool indicates what part of the application code is executed. This a a very effective way to locate functionality in a large, poorly understood system.
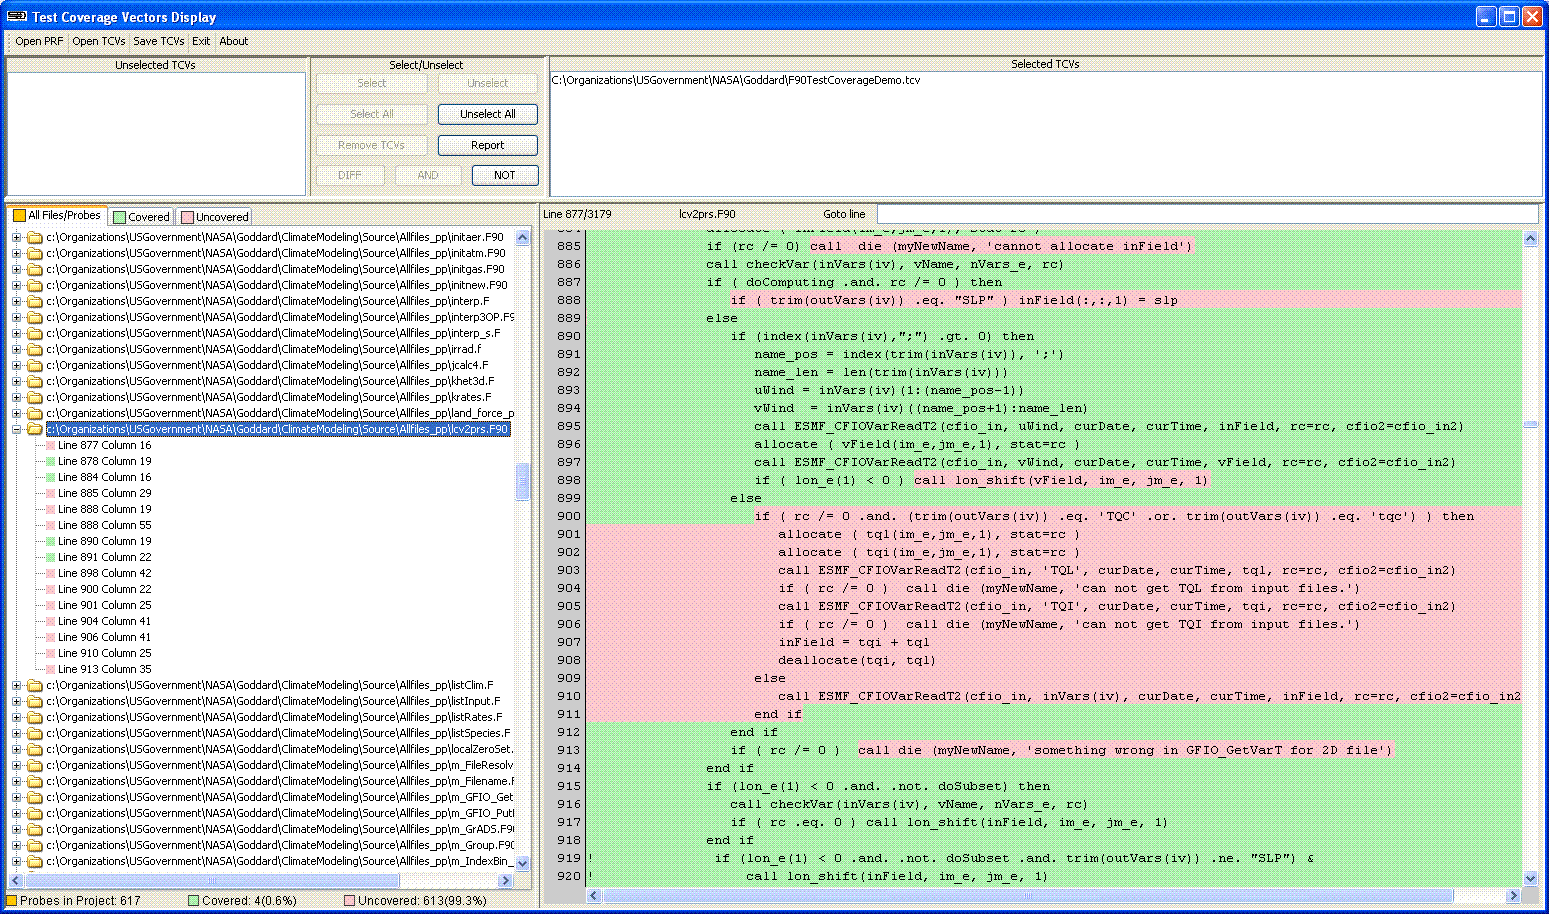
SD's code coverage tools operate by inserting language-specific probes for each basic block in the source files of interest before compilation/execution. At execution time, the probes record which blocks get executed ("coverage data"). On completion of execution, the coverage data is typically written to a code coverage vector file. Finally, the code coverage data is displayed on top of browsable source text for the system under test, enabling a test engineer to see what code has (not) been executed, and to see overall statistics on coverage data.

Typical Features
- Not dependent on any particular compiler or object formats
- Works with tens of thousands of files
- Very low probe overhead (one or two machine instructions per executed probe)
- Can accumulate coverage data from multiple execution runs
- Browsable source files overlayed with collected coverage information
- Produces coverage report by application, subsystem and file
- Code Coverage delta computation and display, to enable test case minimization
- Can operate with custom/embedded application execution environments
- Consistent style and operation across different languages
- Probe installer and display tool operate on Windows 2000/XP/Vista/7
- Application under test can execute in arbitrary native enviroment including embedded WinCE
- Code coverage data from multiple subsystems can be combined into single comprehensive display and summary reports
- Code coverage data from multiple languages can be combined into single comprehensive display and summary reports
Available for the following languages
- Java: client, Server (J2EE), embedded, and RealTime Java, Java 1.2-Java 1.6
- C (ANSI, MSVC6, GNU)
- C++ (ANSI, MSVC6, MSVS2005, GNU)
- C# 2.0, 3.0, 4.0
- COBOL (IBM Enterprise)
- PARLANSE (yes, we use our own tools!)
- PHP4 and PHP5
- PL/SQL
Semantic Designs also provides profiling tools.
Thumbs up to Code Coverage tool
"LSI has integrated Semantic Designs' Test Coverage tool into its special firmware build to measure effectiveness of its internal testing. Fantastic support from Sematic Designs and the simplicity of the tool ensured we were able to integrate the tool in our process in just couple of days. Great thing about this tool is, IT JUST WORKS as expected and as advertised. We are already seeing measurable benefits of using the tool. Today, we have quantifiable data to assess our testing methodologies and track the improvements."
-- Abhijeet Aphale, Lead Engineer, LSI Corporation
Unusual Requirements?
Your language not listed, runs in an unusual environment, or you have some custom need? SD can configure a code coverage tool for you! These code coverage tools are based on DMS, and inherit DMS's language agility and scalability. A white paper on how code coverage is implemented with DMS is available: TestCoverage.pdf
